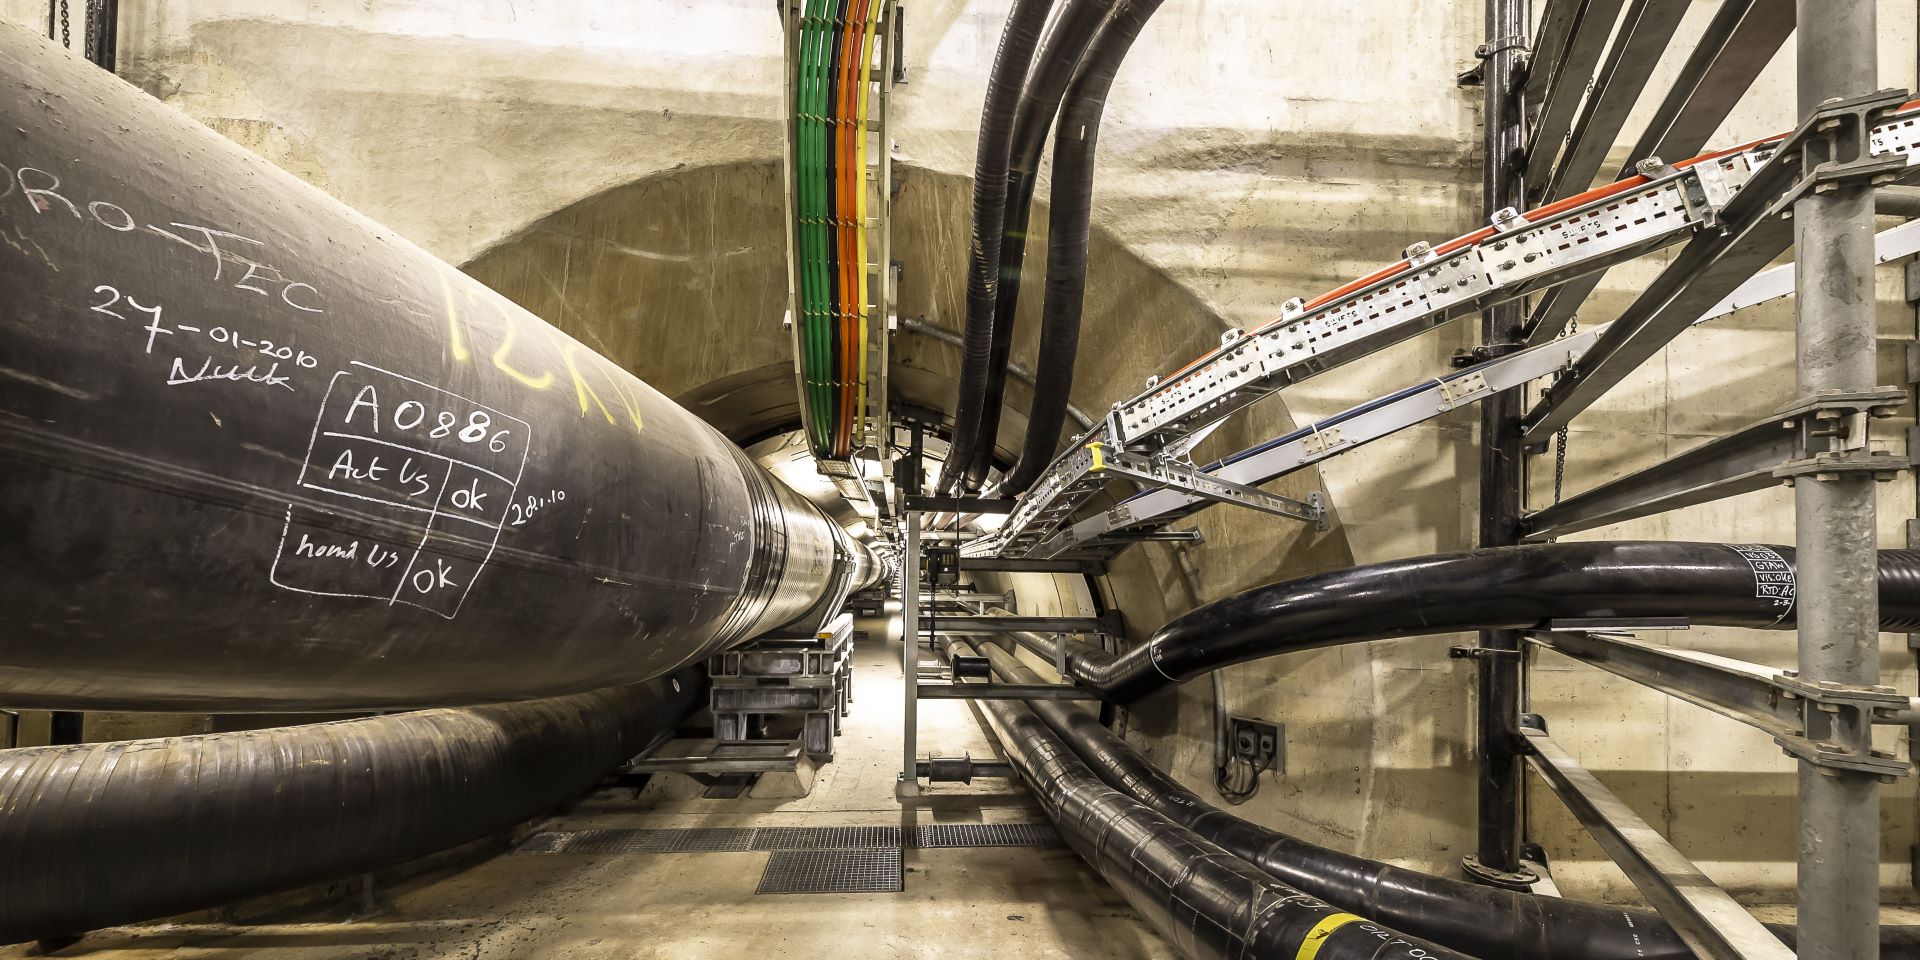
Outcome: Stable pipeline corridor in a safe environment
Challenge: Detecting critical subsidence in scattered (historical) data
Over the years, a lot of data has been collected about the pipelines and structures. Some of this data dates back to 1970. This historical data is of such a magnitude that large-scale analysis is difficult. Subsidence in a delta area is quite normal. But it’s the big changes that cause stress points in these structures.
Solution: (historical) data brought together in one measurement system for detecting risks
The Sweco Monitoring Platform brought all data together in one system. This made it a lot easier to analyze and visualize data in a unified way. Calculations were used to identify the possible stress points. It is precisely the visualisation of the stress point that provides the pipeline managers with valuable information. This allows the managers to focus on points that on average show an increased deviation in change. Placing focus where it is needed.
Result: a safer, cleaner environment through smart asset management
The Sweco Monitoring Platform quickly detected risks in the extensive pipeline corridor. No more hassle with individual measurement files – one central database was used. This made large-scale research easier and more transparent. Critical spots stand out, directing attention and budget, which meant an even safer corridor.
Are you facing a similar challenge? Contact us. We are happy to work together towards a solution!


